
How to Create a Gantt Chart, Step by Step
List your tasks, set their dates, link the ones that depend on each other, and mark the fixed dates as milestones.
Start with the tasks, not the chart
The chart itself is the easy part. The work that makes a Gantt chart useful happens before you draw a single bar: deciding what counts as a task, how big each one should be, and which ones genuinely depend on each other. Get that right and the chart mostly builds itself. Get it wrong and no amount of formatting fixes it.
List every task
Break the project down into tasks small enough that each one has a single clear owner and a definite start and end. A task like "build the website" is usually too large; "design the homepage," "build the homepage," and "review the homepage" are more useful units.
Set start and end dates
Give every task a start date and an end date. For anything with genuine uncertainty, such as a task waiting on an external party or an approval, estimate with a real buffer rather than the fastest plausible outcome.
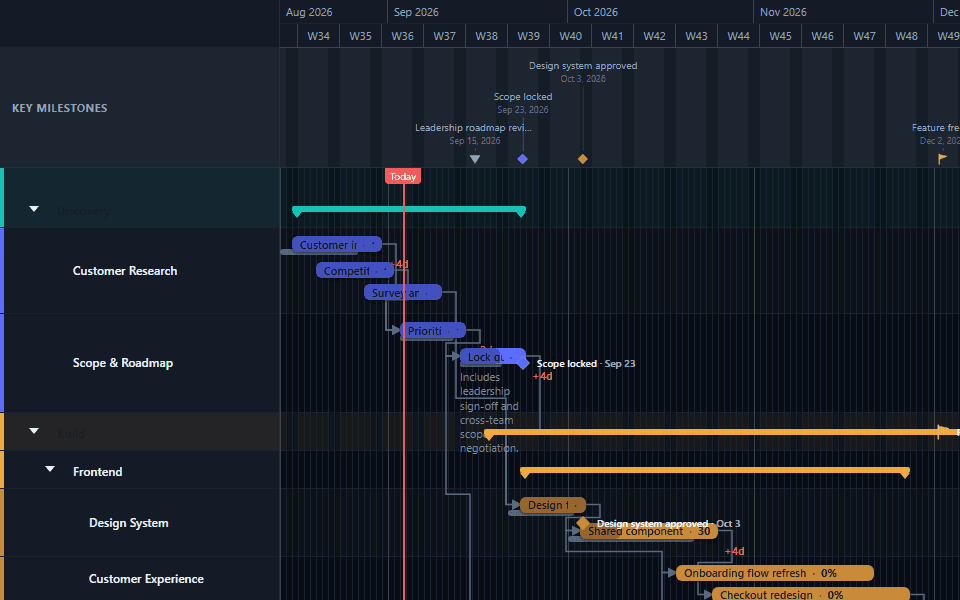
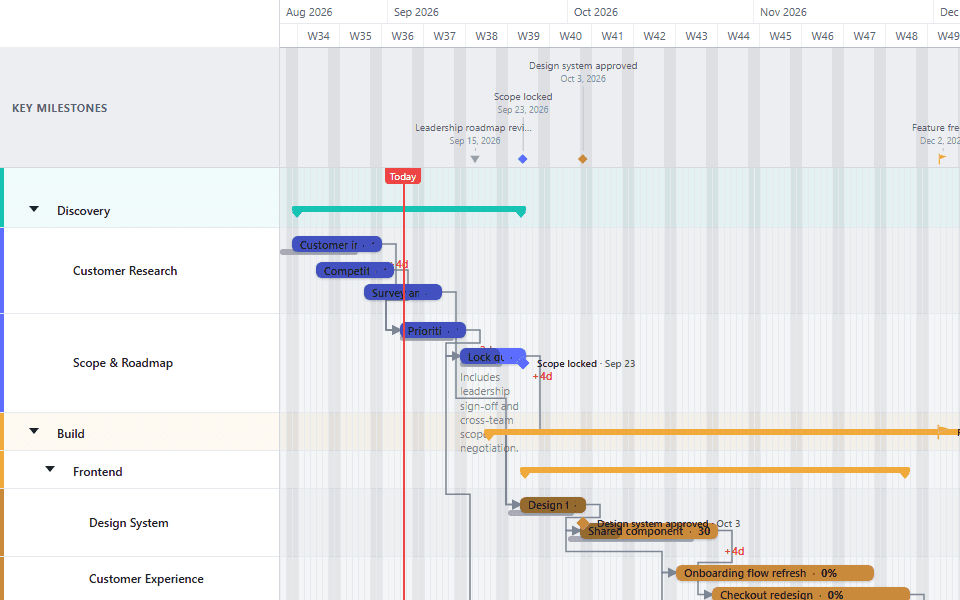
Organize tasks into lanes
Group related tasks into lanes by phase, team, or workstream. A flat, unorganized list of thirty bars is much harder to read than the same thirty tasks grouped into five or six labeled lanes.
Link tasks that depend on each other
Draw a dependency wherever one task genuinely cannot start until another finishes. Most real dependencies are Finish-to-Start; a few need one of the other three types. See dependencies explained for the full set and when to use each.
Add milestones for fixed dates
Mark any date that isn't itself a task (a launch, a signed approval, a regulatory deadline, a conference date) as a milestone rather than forcing it into a zero-duration task bar.
Deciding how big a task should be
This is the single decision that most determines whether the finished chart is useful. Too coarse, and the chart hides the real risk inside enormous bars that don't move until the whole thing is suddenly late. Too fine, and the chart turns into a maintenance burden nobody keeps updated.
A reasonable rule of thumb: a task should be small enough that its owner can say with confidence whether it's on track partway through, and large enough that you're not tracking work that takes less than a day. "Write the proposal" is often too coarse if it hides a week of drafting, review, and revision that could each slip independently. "Send the calendar invite" is usually too fine to be worth its own bar.
When in doubt, err toward slightly coarser tasks on a first draft. It's easier to split an overly broad task once you notice it's hiding real risk than to merge dozens of overly granular ones back together.
Deciding what should be a dependency
The temptation on a first chart is to link everything that happens in sequence, whether or not the sequence is actually required. This produces a chart that looks rigorous and behaves badly the first time you need to move something, because Shift-drag will cascade through every link, including the ones that were never really binding.
A genuine dependency answers yes to: "does the second task literally require an input, a decision, or a resource that only exists once the first task is done?" A task that merely happens to be scheduled after another, because the same person is doing both or because that's the order it was written down in, isn't a dependency; it's an ordering choice, and treating it as a hard link overstates how rigid the plan actually is.
Deciding what belongs on the chart at all
Not everything that happens during a project deserves its own bar. A useful filter: does this item have a start date, an end date, and an owner who's accountable for it landing on time? If yes, it's a task. If it's a fixed point with no duration, it's a milestone. If it's neither, it probably belongs in a different artifact, like a risk log or a meeting agenda, rather than crowding the timeline.
A worked example from nothing
Take a small internal software release: a new reporting feature, three weeks out. The task list might start as: design the feature (3 days), build the backend (5 days), build the UI (4 days), write documentation (2 days), internal review (2 days), fix issues from review (2 days), release.
Sizing pass: "build the backend" and "build the UI" can run in parallel once design is done, since neither depends on the other finishing first, which is worth noting now rather than discovering it later. "Release" isn't a task with duration; it's a milestone.
Dependency pass: design blocks both build tasks (Finish-to-Start). Both build tasks block documentation, since you can't accurately document a feature that isn't built yet. Documentation and the finished builds both feed into internal review. Review blocks the fix task. The fix task blocks the release milestone.
That's six tasks, one milestone, and five dependency links: a small chart, but every link on it is doing real work. Without design finishing, nothing else can start; without review finishing, nothing ships. Nothing was linked just because it was next on the list.
Sanity-checking the chart before you call it done
Before treating a first draft as finished, run through a short checklist. Does every task have a single accountable owner, not "the team" as a group? Does every dependency answer yes to "does the second task genuinely require something only the first task produces"? Is every fixed external date modeled as a milestone rather than buried inside a task's end date? Does the overall chart fit on one screen at a reasonable zoom level, or does it need to be split or reorganized into lanes?
A chart that passes all four checks is usually ready to share. A chart that fails one is usually salvageable with a small adjustment rather than a full rebuild: split an oversized task, remove an unnecessary link, add a missing milestone.
Common mistakes when building a first chart
Starting from a blank chart when a template would fit. Rebuilding a lane structure, dependency pattern, and milestone placement from nothing takes real time when a ready-made template already models a close match. Reach for a blank chart only when nothing available fits the shape of your project.
Making every task the same size. A chart where every bar is roughly a week long, regardless of the actual work inside it, usually means tasks were sized to fit a reporting cadence rather than the real scope of the work. Size tasks by what they actually involve.
Skipping milestones and burying fixed dates inside tasks. A launch date modeled as the end of a task bar, rather than its own milestone, is easy to accidentally move by editing the task instead of protecting the fixed commitment.
Treating the first draft as final. A chart built once at the start of a project and never revisited stops reflecting reality within the first few weeks on almost any real project. Update it as things change, and consider a baseline once the plan is stable enough that drift from it becomes meaningful.
From draft to a chart you can share
Once the structure is in place (tasks sized sensibly, dependencies drawn only where they're real, milestones marking the fixed dates), the remaining steps are about presentation: choosing a zoom level that suits the audience and exporting a clean version for whoever needs to see it.
Common questions
- Should I build a Gantt chart from a blank project or start from a template?
- Start from a template whenever one reasonably fits the kind of work, since the lane structure, dependency pattern, and milestone placement for a typical project of that type are already modeled for you to adjust. Build from a blank chart when your project genuinely doesn't resemble any available template, or when getting the structure exactly right from first principles matters more than speed. See building a timeline from a template for the full walkthrough of that path.
- How many tasks is too many for a single Gantt chart?
- There's no fixed number, but the practical ceiling is set by what a reader can process at once, not by any tool limit. A chart with 200 flat, unlaned tasks is unreadable regardless of how accurate the dates are. Organize into lanes, collapse phases the audience doesn't need to see in full, and consider whether some detail belongs in a separate working chart rather than the one you present.
- Do I need to link every task to every other task with a dependency?
- No, and doing so makes the chart harder to read, not more accurate. Only draw a dependency where one task genuinely cannot start until another finishes, or where the relationship is otherwise binding. A task with no real predecessor should have no incoming links. Over-linking is one of the most common mistakes in a first Gantt chart.
- What should I do if I don't know exactly how long a task will take?
- Estimate with a deliberate buffer rather than the shortest plausible duration, particularly for tasks with real dependency on people, approvals, or external parties. A chart built from optimistic estimates looks precise and is usually wrong within the first week. Revisit and adjust dates as the work becomes clearer rather than treating the first estimate as final.
- Is a Gantt chart still useful for a project that changes constantly?
- Yes, but the discipline changes. On a fast-changing project, update the chart frequently rather than treating it as a one-time artifact, and consider a baseline once the plan stabilizes so you can see how much it actually moved. A Gantt chart that's never updated after the first draft becomes misleading faster on a volatile project than a stable one.