
How to Zoom a Gantt Chart From Days to Quarters
Fit a two-week sprint or a two-year programme on one screen by changing the timeline scale and header rows.
One chart, two very different scales
A two-week sprint and a two-year programme are the same kind of chart at completely different zoom levels. A sprint needs day columns. A programme needs quarters, and day columns would make it unreadable.
Zoom the timeline
Zoom in for day-by-day detail, or out to bring a long programme into view. Fit to window scales the chart so every task fits on screen without scrolling, which is usually the fastest way to find the right level.
Choose the header rows
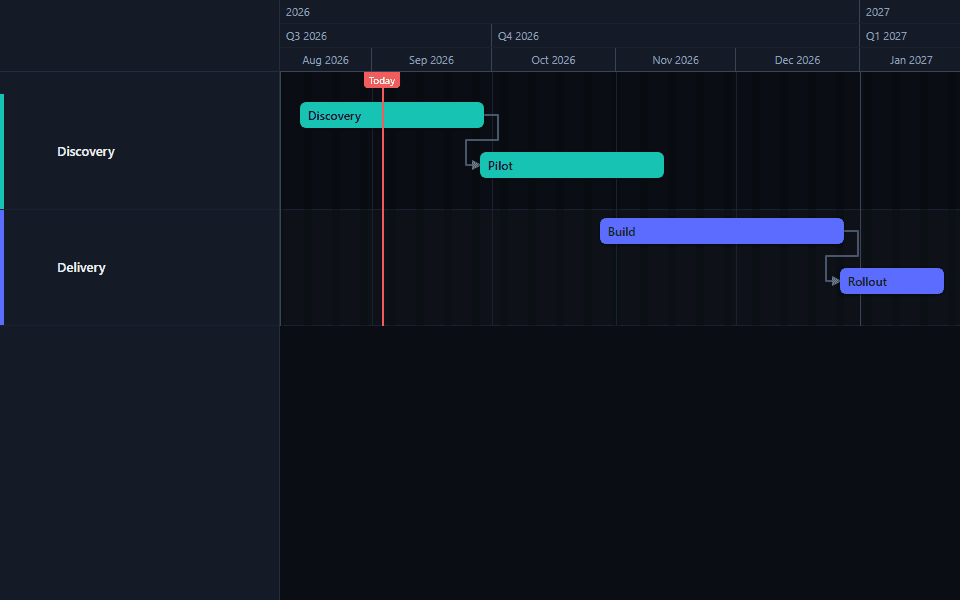
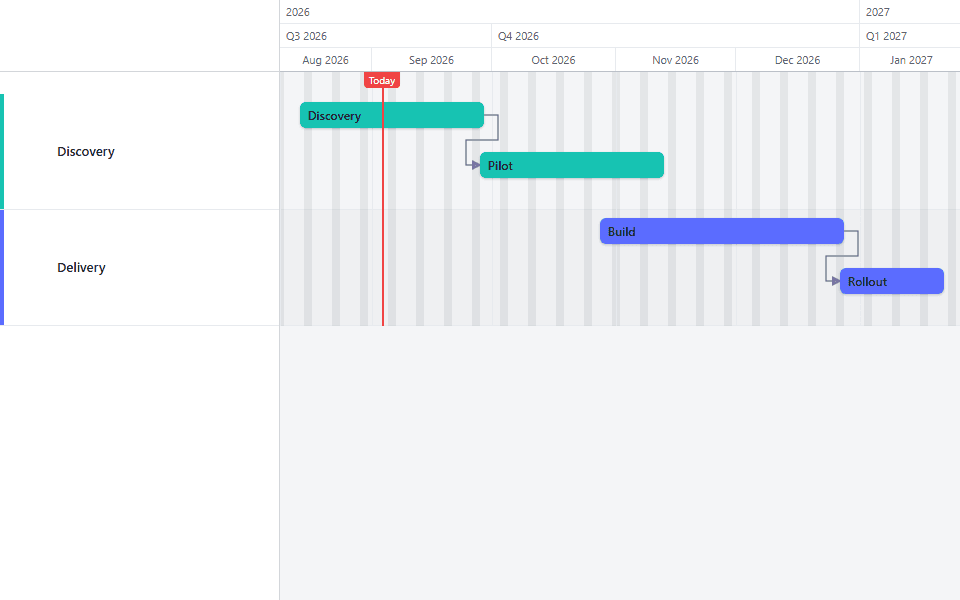
The timeline header can show up to three stacked rows, and each row can be set to year, quarter, month, week, or day. A sprint reads well as month, week, day. A multi-year roadmap reads better as year, quarter, month.
Switch the duration unit to match
Set the duration display to days, weeks, or months so the numbers next to each task read naturally at the zoom level you chose. A day-level view usually wants days; a quarters view usually wants weeks or months.
Matching zoom to the audience, not the project
The instinct is to pick one zoom level for a project and leave it there. In practice, the right zoom level depends on who is looking at the chart and what they need from it, and that changes more often than the project itself does.
A working team view usually wants day or week columns. Enough detail to see which task is due this week, whether two people are double-booked on the same days, and where a short delay would actually bite.
A steering committee or sponsor view usually wants month or quarter columns. Detail at the day level is noise to someone deciding whether the programme is broadly on track. A one-page quarters view answers their actual question, are we roughly where we said we'd be, without forcing them to parse fifty individual task bars.
A multi-year roadmap wants year and quarter as the outer rows. At that scale, individual task starts and ends stop mattering and the shape of the phases becomes the point.
The same underlying project data supports all three. Nothing about zooming changes a task's actual start date, end date, or dependencies; it only changes how much of that detail is visible at once.
Header rows in combination
The three stacked header rows work best when each one is one level coarser than the row below it, so a reader's eye can move from broad context down to specific dates.
A few combinations that read well in practice:
- Sprint or short delivery window: month, week, day. The day row gives working detail; the week and month rows give context for where in the sprint you are.
- Quarterly programme review: quarter, month, week. Drops the day row entirely, since day-level precision rarely matters at this scale.
- Multi-year strategic roadmap: year, quarter, month. The month row still shows some texture without cluttering a view meant to be read from across a room.
Avoid combining rows that are too close together, like week and day stacked with nothing coarser above them; that gives detail without the context a second, wider row is supposed to provide.
Zoom is a view, not a copy
A common early mistake is treating different zoom levels as if they require different project files, building one version for the team and a separate, simplified version for leadership. That duplicates the maintenance burden and guarantees the two versions drift apart the first time someone forgets to update both.
Zoom and header-row settings live on the view, not on the underlying task data. The same project can be shown at day-level detail one moment and exported as a one-page quarters view the next, with nothing about the tasks themselves changing. Adjust the zoom immediately before each export rather than maintaining parallel copies of the plan.
This matters most on a project that reports to more than one audience on a regular cadence. A weekly team stand-up and a monthly steering committee looking at the same underlying plan is a common pattern, and it works cleanly precisely because the plan itself never forks. Change the zoom and header rows, export, and the two versions still describe exactly the same tasks, dates, and dependencies underneath.
Choosing header rows for a specific chart length
Beyond the three example combinations above, a useful way to think about header rows is to ask how many distinct time units a reader needs to orient themselves, given how long the chart actually runs.
A chart spanning six weeks or less rarely benefits from a year row at all; every task falls inside the same year, so that row adds width without adding information. Two rows, week and day, usually cover it.
A chart spanning six months to two years is where the three-row combinations above earn their keep: year or quarter for the outer context, month or week for the working detail underneath.
A chart spanning multiple years, the kind used for a strategic roadmap or a long-term capacity plan, can drop week and day entirely. At that length a reader is orienting by quarter and year, and showing week-level header divisions would only compress everything else on the timeline to make room for a row nobody is using to navigate.
Common mistakes
Leaving the duration unit on days at a wide zoom. A task duration reading "126 days" next to a bar that spans most of a quarters-view chart is harder to read than "18 weeks" would be. Switch the unit when you switch the scale.
Zooming out so far that dependency arrows become unreadable. At an extreme zoom level, closely spaced tasks compress into a solid block and the arrows connecting them become impossible to trace. If dependencies matter to the audience, keep enough zoom for the arrows to stay legible, even if it means the chart runs to two pages instead of one.
Forgetting to re-run Fit to window after adding tasks. A zoom level that fit the project last week may no longer fit it after new tasks were added at the edges. Re-run Fit to window rather than assuming the old setting still works.
Using three header rows when two would do. A third row adds information density but also visual weight. If the middle row (usually month) doesn't add anything a reader needs, drop to two rows for a cleaner header.
Zoom and dependencies together
Wide zoom levels make it easy to lose track of exactly how a delay ripples through a dependency chain, since the visual gap between linked tasks compresses. Before presenting a rescheduled plan at a wide zoom, it can help to check the change at a closer zoom level first: see rescheduling without breaking dependencies for how a Shift-drag cascade behaves regardless of the current zoom setting.
Pick the zoom level for the audience, not the plan. The same project can be a detailed working view for the team and a one-page quarters view for a steering committee, without rebuilding anything. When you have the view you want, export it.
Quarter-scale views are already built into the Executive Roadmap template and the Technology Roadmap template, both illustrating a multi-quarter programme at the header-row combination described above.
Common questions
- What is the fastest way to fit a whole project on one screen?
- Use Fit to window. It calculates the zoom level that shows every current task without scrolling, which is usually faster than manually zooming out step by step and checking each time. It recalculates based on your current tasks, so if you add or remove work later, run it again rather than assuming the old zoom level still fits everything.
- Can I show different zoom levels to different audiences from the same project?
- Yes. Zoom and header row settings are a view, not a change to the underlying project data. The same chart can be a detailed day-level view for the team one day and a one-page quarters view for a steering committee the next, without rebuilding anything or losing any task data. Adjust the zoom before each export rather than maintaining separate copies of the project.
- How many header rows can I show at once?
- Up to three, stacked above the timeline. Each row is set independently to year, quarter, month, week, or day. A common combination for a multi-year roadmap is year, quarter, month; a common combination for a sprint-level view is month, week, day.
- Why do my task duration labels look strange after I zoom out?
- The duration unit and the zoom level are separate settings, and they can drift out of sync. A duration shown in days is easy to read on a day-level zoom but awkward on a quarters view, where "84 days" is harder to parse at a glance than "12 weeks." Switch the duration unit to weeks or months when you zoom out for a longer view.
- Does zooming out lose any detail from the underlying tasks?
- No. Zoom only changes how the timeline is displayed, not the task data itself. Every task keeps its exact start date, end date, dependencies, progress, and baseline regardless of zoom level. Zooming back in reveals the same detail that was there before you zoomed out.