
How to Build a Simple Gantt Chart
A small project doesn't need every feature. Tasks, dates, and a couple of milestones are often the whole chart, and you can build that on a Free plan.
Not every project needs the full feature set
A lot of Gantt chart guidance assumes a large, multi-phase project with nested workstreams, several dependency types, and formal baseline tracking. Most real projects, especially a first one, don't need any of that. A simple Gantt chart is genuinely just tasks, dates, and maybe a couple of milestones, and that's often the whole chart a small project needs.
This guide is for that case: a handful of tasks, straightforward sequencing, nothing that requires more structure than a Free plan already provides.
List only the tasks that matter
Name the real phases or deliverables, not every small step along the way. A simple chart for a five-week project might have five to eight tasks, not thirty.
Set dates without over-engineering dependencies
Give each task a start and end date. Add a dependency only where one task genuinely can't start until another finishes; for most simple projects, that's a small number of links, sometimes just one or two.
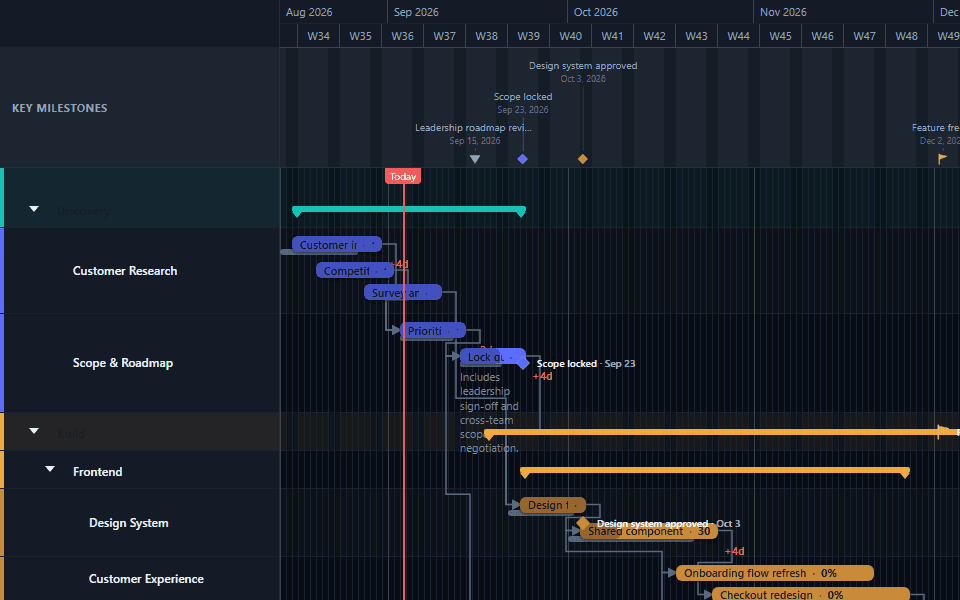
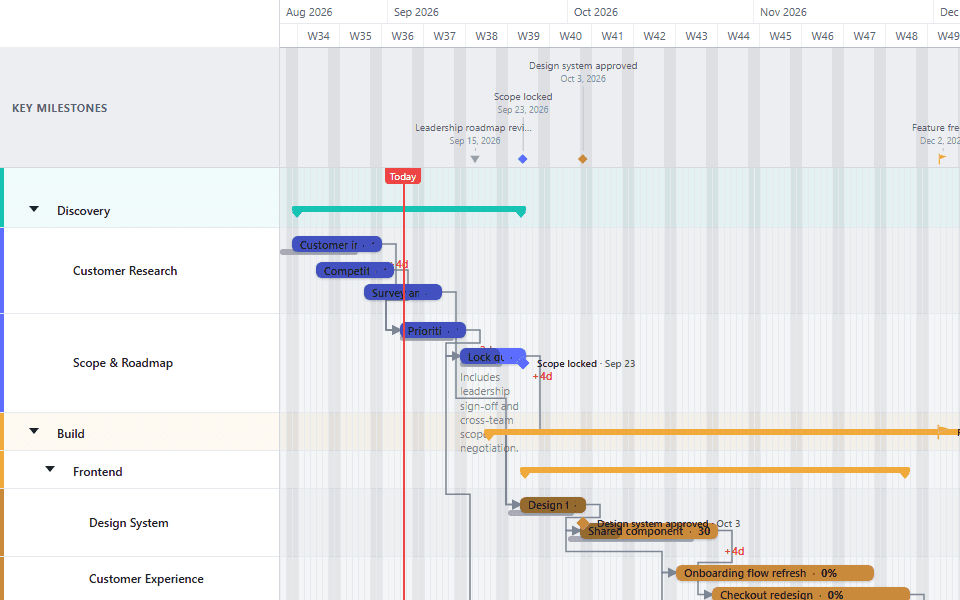
Add one or two milestones for fixed dates
If there's a launch date, a deadline, or a delivery date that isn't itself a task, mark it as a milestone rather than squeezing it into the end of a task bar.
What "simple" actually means here
Simple doesn't mean small in scope, it means light on structure. A ten-task chart with no nested lanes, one dependency type, and no baseline tracking is simple regardless of how important the underlying project is. A three-task chart with sub-lanes, custom colours, and every dependency type in use is more complicated than it needs to be, regardless of how few tasks it has.
The goal is matching the chart's structure to what the project actually requires, not stripping features for their own sake. If a genuine need for a baseline or a nested lane shows up later, add it then; starting simple doesn't lock you out of adding structure as the project grows.
What's already included on Free
Everything a simple chart needs is available without upgrading: unlimited tasks, milestones, Finish-to-Start dependencies, manual progress tracking, one browser-saved project, and PNG export with a small watermark. A genuinely simple project can be built, tracked, and shared entirely on the Free plan.
Signs your "simple" chart is outgrowing the label
You keep wanting to group tasks under a phase. If several tasks under one heading are starting to feel like they need their own sub-structure, that's a sign the project has grown past strictly simple, even if the total task count hasn't changed much.
Two tasks genuinely overlap rather than following each other. Finish-to-Start covers "this can't start until that ends." If you find yourself needing "this can't finish until that finishes" or a similar overlapping relationship, that's a different dependency type, and worth revisiting once it comes up.
You want to compare the current plan against what was originally agreed. That's exactly what a baseline is for. Needing to track drift against an original commitment is a sign the project has moved from a working sketch into something being held accountable against a plan.
None of these signs mean you did something wrong by starting simple. They mean the project grew, which is a normal and expected outcome, not a planning failure.
A worked example
A five-week website redesign might look like this as a simple chart: Design (week 1), Build (weeks 2 to 3), Content (week 2, running alongside Build since it doesn't depend on it), Review (week 4), Launch as a milestone at the end of week 5. That's five rows and two dependency links (Design into Build, and Review into Launch), with Content sitting unlinked because nothing else in the plan genuinely depends on when it happens relative to the other tasks.
Notice what didn't happen here: no sub-lane grouping Design and Build under a "Phase 1" header, no dependency drawn between Content and Build just because they happen to run at the same time, no baseline, because nobody has asked yet whether the plan drifted from an original commitment. Each of those would be a reasonable addition if the project actually needed it. None of them are needed for this one.
Keeping it simple as the project runs
A chart that starts simple doesn't have to become complicated just because time passes. The discipline that keeps it simple is resisting structure that isn't earning its place yet, not avoiding all future changes.
Update dates as things change, without adding dependencies to explain every change. If Build ran a few days long, move its end date. That alone doesn't mean Content, which was never dependent on Build anyway, needs a new link connecting them.
Add a milestone when a new fixed date appears, rather than folding it into an existing task. If a client review gets scheduled partway through, and it's a fixed date rather than a task with duration, give it its own milestone marker instead of squeezing it into the end of whichever task happens to be running that week.
Resist adding a dependency just to make the chart look more thorough. A chart with more links isn't automatically a better chart. Every dependency you draw is something Shift-drag will cascade through later, so an unnecessary one adds risk of an unintended move, not just visual complexity.
Building it faster with a template, if one fits
If your simple project resembles one of the available templates closely enough, applying one and deleting what you don't need can be faster than building from a blank chart; see building a timeline from a template for that path. Applying a template needs a Pro plan; if your project is small enough to stay Free, building from blank is usually just as quick and avoids stripping down a template built for a more complex, illustrative scenario.
For the general step-by-step regardless of project size, see how to create a Gantt chart. If the project later grows past what a simple chart comfortably holds, dependencies explained and tracking schedule slip with a baseline cover the two most common next steps.
Common questions
- Can I build a simple Gantt chart without paying for anything?
- Yes. Tasks, dates, milestones, one dependency type (Finish-to-Start), and progress tracking are all available on the Free plan, which covers everything a genuinely simple chart needs. Free also exports a PNG, with a small watermark. Pro adds things a simple chart usually doesn't need yet, like sub-lanes, custom colours, extra dependency types, and baselines.
- What makes a Gantt chart "simple" rather than a smaller version of a complex one?
- The difference isn't size alone, it's structure. A simple chart has a small number of tasks, minimal or no nested lanes, and dependencies only where they're genuinely necessary. A complex chart on the same number of tasks can still be simple if it avoids sub-lanes, exotic dependency types, and baseline tracking it doesn't actually need yet. Simplicity is a deliberate choice about how much structure to add, not just a task count.
- When should I upgrade from a simple chart to a more structured one?
- When the plan genuinely needs something Free doesn't offer: nested lanes because a phase has its own internal workstreams, a baseline because the schedule needs to be tracked against an original commitment, or a dependency type beyond Finish-to-Start because two tasks overlap instead of following strictly one after another. Upgrade because the project outgrew the simple structure, not on a schedule.
- Do I need dependencies at all for a simple project?
- Only where they're real. A small project with three or four sequential phases might have just as many dependency links, one between each pair of adjacent phases. A project with mostly independent, parallel tasks might have none. Don't add a dependency just because two tasks happen to be listed one after the other.
- Is a template a faster starting point than building a simple chart from scratch?
- Templates are a Pro feature for applying, though browsing them is free on every plan. For a genuinely simple project, building from a blank chart is often just as fast, since there's less to strip out of a template built for a more complex, illustrative scenario. Start from a template when your project closely matches one; build from blank when it's simpler than any available template.