
How to Track Schedule Slip With a Baseline
Save a task's agreed dates, then compare them with its current planned start and end.
Compare the baseline with the current plan
A baseline is a snapshot. Record a task's dates once, keep planning, and GanttFlow will show how far the task's current planned dates have moved from that snapshot.
This solves a specific and very common credibility problem. Without a baseline, a project plan silently rewrites its own history: every time you drag a bar, the old date is gone, and the chart always shows a project that is exactly on schedule for the schedule it currently has. Everyone in the room knows this is not true, which is why an unbaselined chart tends to be treated as decoration rather than evidence.
Set a baseline on a task
Select a task and click "Set baseline from current dates" in the panel. This records its current start and end as the baseline. Both dates are set together, so a task always has a complete baseline or none at all.
Turn on Show baselines
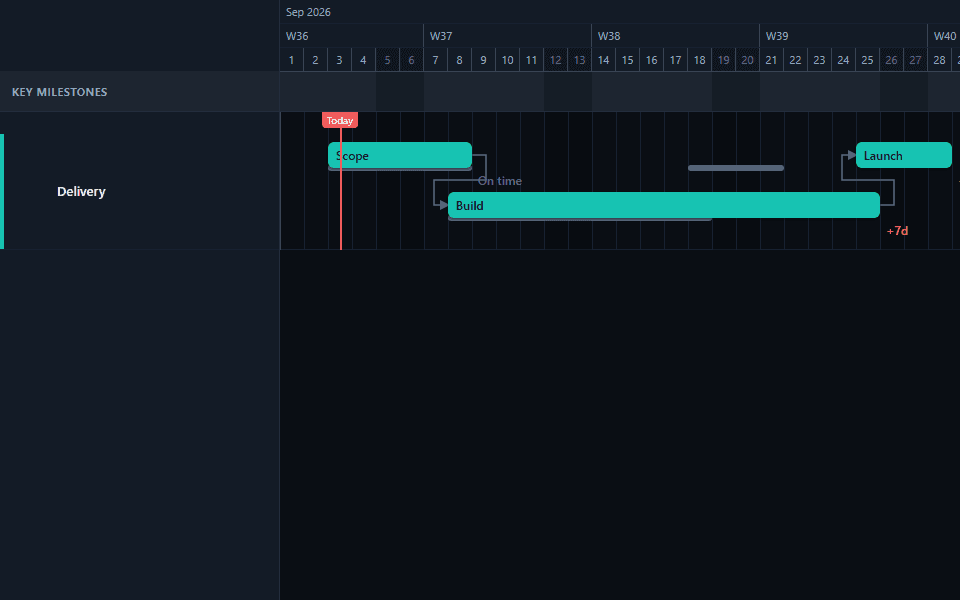
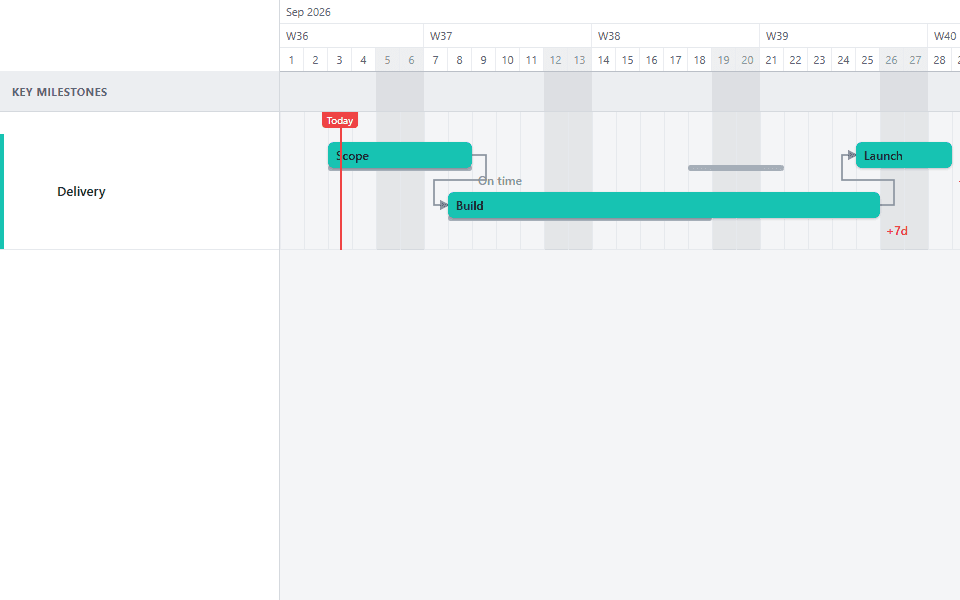
In Display settings, turn on Show baselines. GanttFlow compares each task's current planned start and end against the baseline saved on that task.
Read the variance label
Each bar can show a label like "+7d" or "On time," colored by whether the task moved later, earlier, or not at all.
When to set the baseline
This is the decision that determines whether baselines are useful or annoying, and the instinct to baseline immediately is usually wrong.
Baseline when the plan becomes a commitment, not when it becomes a chart. Those are different moments. A plan you are still shaping will move a dozen times in its first week, and baselining it produces variance labels that measure your own drafting rather than any real slip.
Concretely, that usually means:
- On a funded programme, baseline at budget approval. Before that the dates are a proposal.
- On a software release, baseline after the architecture review, when the estimates are grounded in something.
- On a construction project, baseline at contract signature, so the comparison is against the contractual programme.
- On a campaign, baseline at creative lock, the point after which changes cost money.
The common thread: baseline at the moment someone else starts relying on your dates.
Reading variance honestly
A variance label is a number, and numbers invite over-interpretation. A few things worth holding in mind when you present one.
An earlier planned finish is not automatically good. It can mean the task was overestimated, that scope quietly left it, or that it was not the thing blocking anyone. The baseline records the date change, not the reason.
Small variance on a long task is noise. Three days of drift on a fourteen-week bar is inside the estimating error. Three days on a one-week bar is a forty per cent overrun. Read the label as a proportion, not an absolute.
A variance label does not tell you whether delivery moved. GanttFlow does not calculate a critical path or float. Use your own schedule logic to decide which tasks control the finish date, then focus the status discussion on those tasks.
Accumulated small slips are the real pattern. One task at plus four days is a task. Nine tasks at plus four days is a systematic estimating problem, and it is visible only because the baseline kept the original numbers.
Baselines and dependencies together
These two features interact in a way worth understanding before your first status meeting.
When you hold Shift and drag a task on a linked chart, everything reachable downstream moves by the same offset. If those downstream tasks are baselined, they will all immediately show variance, even though nobody changed them individually. A normal drag moves only the selected task.
It does mean a chart can go from all-green to mostly-red after one drag, which is worth explaining when you present it. The useful framing is that one task slipped and eight tasks inherited it, not that nine things went wrong.
What a baseline will not tell you
Why something slipped. The chart records that a date moved, never the reason. Keep that in the written commentary beside the export; six months later it is the only thing anyone actually wants to know.
Whether the original estimate was any good. A task that finished exactly on baseline might have been well estimated or generously padded. Variance measures adherence to a plan, not the quality of the plan.
Scope changes. If a task grew because someone added work to it, the variance label shows a delay with no indication that the task is now a different task. This is the single biggest limitation to be aware of, and the reason a baselined chart should always travel with a note about what changed.
Common mistakes with baselines
Baselining the first draft. Produces variance labels that measure your own planning process. Wait until the plan is agreed.
Re-baselining after every slip. This resets the comparison and destroys exactly the history that made the baseline worth having. A plan that has been re-baselined three times is a plan that has never been late, which nobody believes. Re-baseline only after a formally approved change of scope or dates, and say so when you do.
Baselining some tasks and not others. Variance labels appear only where a baseline exists, so a partially baselined chart looks like a mostly on-time project. Baseline the whole plan or none of it.
Hiding the baselines before a difficult meeting. Tempting, and it is the fastest way to lose the credibility the feature exists to build. A chart that visibly slipped twice for stated reasons is far more trustworthy than one that has always been perfect.
Using it in a status update
The rhythm that works: update the current planned dates, enter progress manually, review the variance labels, and export a PNG with baselines showing. Add written commentary for actual starts, finishes, and reasons for change. The chart then shows what was agreed, what is planned now, and the gap between those dates.
One further habit worth forming: keep the previous week's export. A single baselined chart shows where you are against the plan, but two consecutive exports show the direction: whether the gap is widening, holding, or closing. That trend is usually the thing a sponsor actually wants to know, and it costs nothing beyond not deleting last week's image.
See baseline presentation patterns in the product delivery template and executive roadmap template. Their dates and variances are illustrative; replace them with an approved baseline for your project.
Common questions
- When should I set a baseline on a project?
- At the moment the plan becomes a commitment rather than a draft - budget approval on a funded programme, contract signature on a construction project, architecture review on a software release, creative lock on a campaign. Baselining a plan you are still shaping produces variance labels that measure your own drafting rather than any real slip.
- Should I re-baseline after a project slips?
- Only after a formally approved change of scope or dates, and say so when you do. Re-baselining after every slip resets the comparison and destroys the history that made the baseline worth keeping. A plan that has been re-baselined three times has never been late on paper, which nobody in the room will believe.
- Why did every task suddenly show variance after I moved one?
- This happens after a Shift-drag, which moves the selected task and everything linked downstream by the same offset. Any baselined successor then shows the inherited delay. A normal drag moves only the selected task. Frame the result as one task moving and the linked work inheriting the same change.
- Does a baseline show why a task slipped?
- No. The chart records that a date moved and nothing about the reason, and it cannot distinguish a delay from a task that quietly grew in scope. Keep the explanation in the written commentary beside the export - six months later it is the only part anyone actually wants to know.
- Is a planned finish ahead of baseline a good sign?
- Not necessarily. A planned finish moving well ahead of baseline can mean the task was overestimated, that scope left it, or that it was not blocking anyone. Read variance as a proportion of the task's length too: three days on a fourteen-week bar is different from three days on a one-week bar.