
How to Export a Gantt Chart to PowerPoint
Export a Gantt chart as a PNG, place it on a PowerPoint slide, and keep the result readable for clients or leadership.
Put the chart on a slide as a picture
PowerPoint can insert a PNG from your computer. The reliable workflow is to prepare the chart in GanttFlow, export it as a PNG, then insert that file on the slide.
Prepare a slide-sized chart
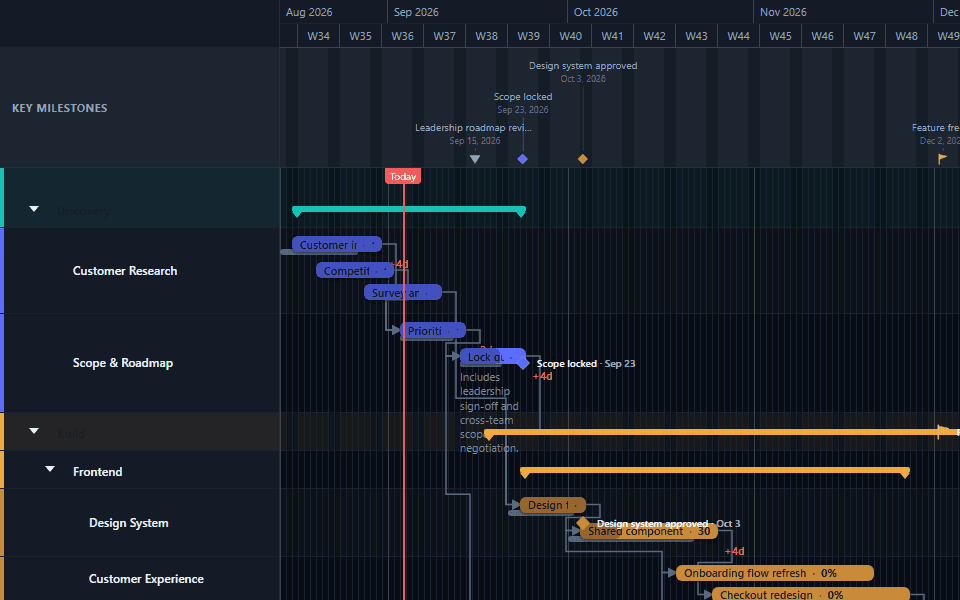
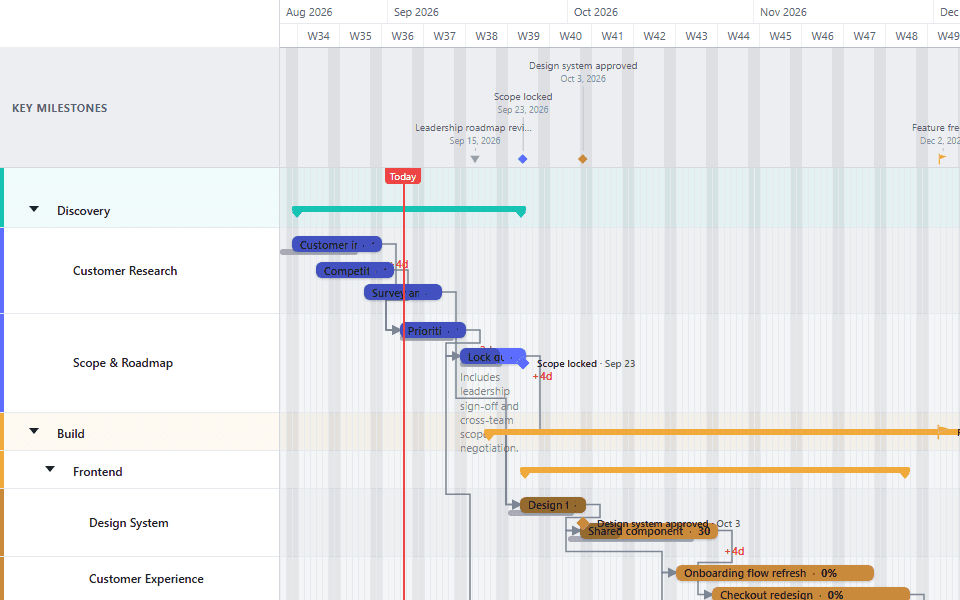
Collapse detail the audience does not need. Shorten crowded task names and zoom out until the timeline is wider than it is tall. A slide usually reads better with fewer than 20 visible bars.
Export the chart as a PNG
Choose PNG from the export menu. Save the file somewhere you can find from PowerPoint.
Insert the PNG in PowerPoint
Select the place on the slide where the chart should appear. In PowerPoint, open Insert, choose Pictures, then This Device. Select the exported PNG and choose Insert. These steps follow Microsoft's PowerPoint picture instructions.
Size and position the chart
Resize from a corner so the image keeps its proportions. Leave room for the slide title and one short note stating the reporting date, decision, or schedule change the audience should notice.
What stays editable
The PNG is a static picture. You can resize, crop, and position it in PowerPoint, but you cannot edit its task bars, dates, dependencies, milestones, or labels as separate slide objects. Make schedule changes in GanttFlow and replace the image on the slide with a new export.
Why not just build the chart directly in PowerPoint?
PowerPoint can draw a rough set of bars using its native shapes or SmartArt, and for a single slide with no future changes, that's a workable option. Where it breaks down is everything after the first draft.
Every date change is a manual redraw. A shape-based bar has no underlying date. Moving a task by three days means dragging a rectangle by eye and hoping the new position is close enough, rather than typing a date and letting the chart place it precisely. On a plan that changes weekly, this adds up fast.
There's no dependency logic. PowerPoint shapes don't know about each other. Shifting one task that other work depends on means manually finding and redrawing every affected bar yourself, with no equivalent of a Shift-drag cascade to do it in one motion.
Formatting drifts the more you edit it. Bars built as individual shapes tend to fall slightly out of alignment after a few rounds of manual adjustment: inconsistent bar heights, gaps that don't quite line up with the date grid, labels that overlap after a resize. A chart built from actual task data doesn't have this problem, because the layout is calculated from the dates every time.
It doesn't scale past a handful of tasks. A five-bar illustrative timeline is manageable by hand. A thirty-task project schedule, maintained slide-by-slide in PowerPoint over several months, becomes its own maintenance project.
None of this means PowerPoint is the wrong tool; it's an excellent way to present a finished chart, which is exactly what exporting a PNG and placing it on a slide accomplishes. The distinction worth keeping is between PowerPoint as the presentation layer and PowerPoint as the place where the schedule itself lives. Building and maintaining the actual plan in GanttFlow, then exporting a current picture whenever you need one, keeps the source of truth in one place instead of scattered across however many decks reference it.
Matching a widescreen slide
A modern 16:9 slide is much wider than it is tall, and a Gantt chart with many lanes tends to be the opposite: tall and narrow once every task fits. Two adjustments make the export fit a widescreen slide without shrinking labels past readability. Collapse sub-lanes you don't need for this particular update, since a collapsed parent lane still shows its own summary bar. And zoom the timeline out one level (days to weeks, or weeks to months) before exporting, which shortens the chart's rendered width relative to its height. Exporting at the chart's natural proportions and then stretching the picture to fit the slide is the one adjustment to avoid, since it distorts bar widths and makes duration comparisons visually misleading.
A practical slide layout
Use a short title that states the decision or period, such as "Launch plan, 6 September 2026." Place the chart across most of the slide width. Add no more than three short notes beside or below it: what changed, what is at risk, and what decision is needed.
For a client presentation, the executive roadmap template gives a compact example. For a multi-project steering update, use the project portfolio template. Both schedules are illustrative and need your own dates, durations, and dependencies.
Troubleshooting
The chart is too small to read. Return to GanttFlow and remove detail before exporting. Enlarging an already crowded picture does not make it clearer.
The image looks soft. Insert the exported PNG file directly. Avoid taking a screenshot of the editor or copying an image from a chat preview.
The slide is out of date. Add the reporting date beside the chart. When the plan changes, re-export from GanttFlow and replace the picture.
You need a file the client can print or archive. Export a PDF on Pro instead. See the PDF export guide.
Colours look different from the editor. The export captures whatever theme is active when you click Export. If the deck uses a specific palette, switch the chart theme to match before exporting rather than trying to recolour the PNG afterward: a flattened image has no separate task-bar layer left to recolour.
Recurring status decks
A weekly or monthly status deck usually reuses the same slide across many reporting cycles: same title format, same chart position, same three-note layout beside it. Once that layout is set once, updating it each cycle is a two-step routine: open the project in GanttFlow, adjust dates or progress, and export a fresh PNG, then replace the picture on the existing slide rather than rebuilding it. PowerPoint's Replace Picture command (right-click the existing image, or Picture Format > Change Picture) keeps the current size, position, and any alt text, so only the image content changes between reporting periods.
Multiple charts in one deck
A steering deck sometimes needs more than one Gantt view: a portfolio-level summary slide followed by one detail slide per workstream. Export each view as its own PNG at the zoom level appropriate to its slide: the summary can show a full-project overview with lanes collapsed, while each detail slide can zoom into just its own workstream's tasks. Keeping the exports as separate files, named for the slide they belong to, makes replacing just one of them at update time faster than searching an unlabeled folder of "chart.png", "chart (1).png", "chart (2).png".
Common questions
- Can I edit Gantt task bars in PowerPoint after export?
- No. The exported chart is a static PNG, so PowerPoint treats it as one picture rather than separate task bars, arrows, or labels. Make schedule changes in GanttFlow, export a new PNG, and replace the old picture on the slide.
- Does the Free plan export a PowerPoint-ready image?
- Yes. Free can export a PNG that PowerPoint can insert, with a GanttFlow watermark. Pro removes the watermark from PNG exports and adds clean PDF export.
- Why is the text too small after I place the chart on a slide?
- The chart contains too much detail for one slide. Collapse sub-lanes, shorten task labels, or zoom out before exporting. If the audience needs both summary and detail, use two slides rather than shrinking one image until the labels are unreadable.
- Should I use PNG or PDF in PowerPoint?
- Use PNG for a slide. PowerPoint inserts it as a picture that you can resize and position. Use PDF when the chart itself is the document you will send, print, or archive.
- Can I paste the chart into PowerPoint instead of inserting a file?
- Copying an image from a browser preview or a chat window usually re-compresses it, so text on the bars turns soft at slide resolution. Export the PNG to a file first, then use Insert > Pictures > This Device so PowerPoint reads the original file rather than a copied preview.
- Does the exported PNG keep my chart's theme and colours?
- Yes. The export captures the chart exactly as it renders on screen, including the active colour theme, lane colours, and any custom fonts in use. Match your chart's theme to the deck's colour palette before exporting rather than adjusting it afterward in PowerPoint, since the image can't be recoloured once inserted.