
Project Status Reporting with Gantt Charts
Keep the planned dates, progress, milestones, and baseline variance on one chart. Update the source project, export a dated view, and add the explanation beside it.
Free includes one browser-saved project and manual progress. Baselines and clean exports require Pro.
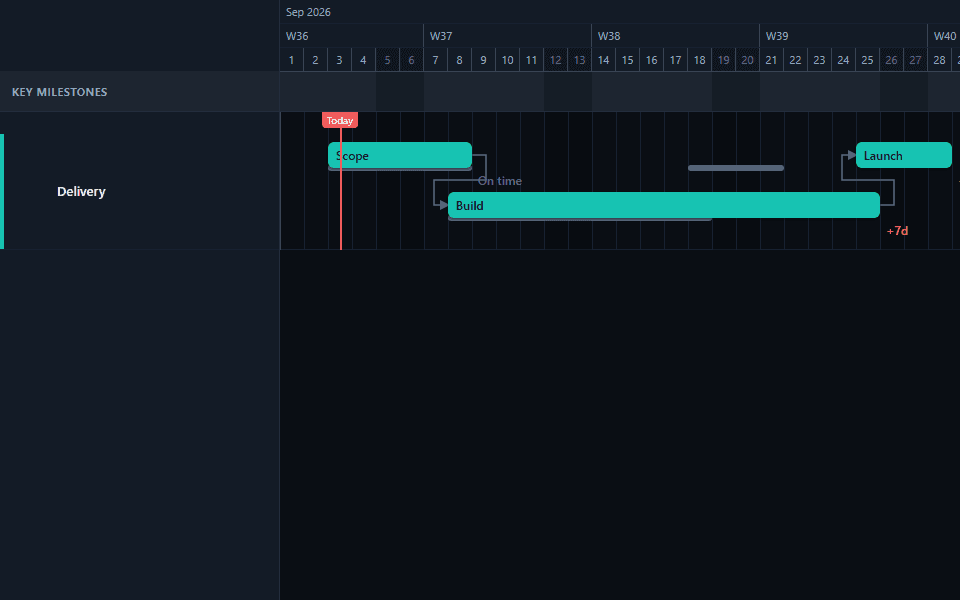
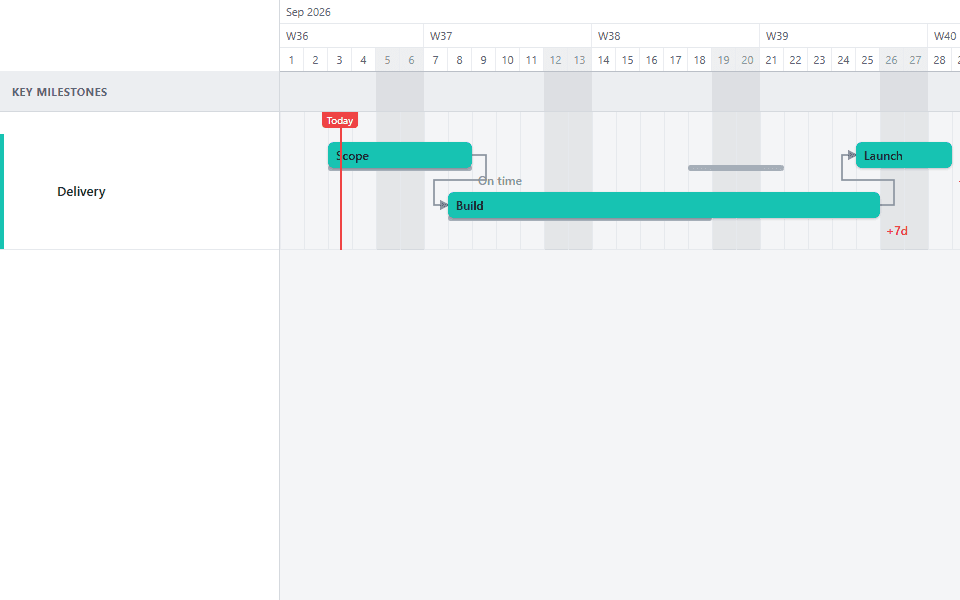
Answer four status questions
- What is planned now? The current task start and end dates.
- What moved? The gap between current planned dates and the saved baseline.
- How much is complete? The progress value entered for each task.
- What happens next? The upcoming linked work and milestones.
Update the chart before the commentary
Move the planned dates that changed. Use a normal drag for one task, or hold Shift while dragging when the same offset should move every task and linked milestone downstream. Then enter progress manually and review the visible variance.
Example weekly update
Set the reporting date to 6 September 2026. Update the current planned finish for QA, enter its accepted-work progress, and keep the approved dates as the baseline. Export the chart, then add three notes: QA moved five days, Launch remains fixed, and the team needs a scope decision by 9 September 2026.
If Launch is linked downstream and should move with QA, use Shift-drag. If Launch is a fixed conference or contractual date, leave it unlinked so the marker stays put while the remaining gap becomes visible.
Use examples as a starting point
The Product Delivery template shows progress across a delivery cycle. The Executive Roadmap template shows a more compact sponsor view. Template schedules and status values are illustrative, and applying a template requires Pro.
Read how to report percent complete, how to compare a baseline, and how normal drag and Shift-drag differ before the first reporting cycle.